Have a question? Enter a search term. Or give us a call at 1-888-518-0818
Mission Control Forecasting helps your team understand future workload, scheduling capacity, and revenue opportunities before the day even begins.
Using the previous eight weeks of completed work history, Forecasting identifies your business’s natural scheduling patterns and compares them against your current bookings in real time.
The result is a live operational forecast that helps dispatchers, managers, and sales teams make smarter scheduling decisions throughout the week.
Mission Control Forecasting helps you:
● Predict the expected workload by day
● Compare booked jobs against projected demand
● Identify underbooked days
● Detect overbooked schedules before problems occur
● Visualize schedule capacity using color-coded indicators
● Surface hidden revenue opportunities
● Guide scheduling decisions proactively
Forecasting continuously updates as appointments are added, moved, or completed.
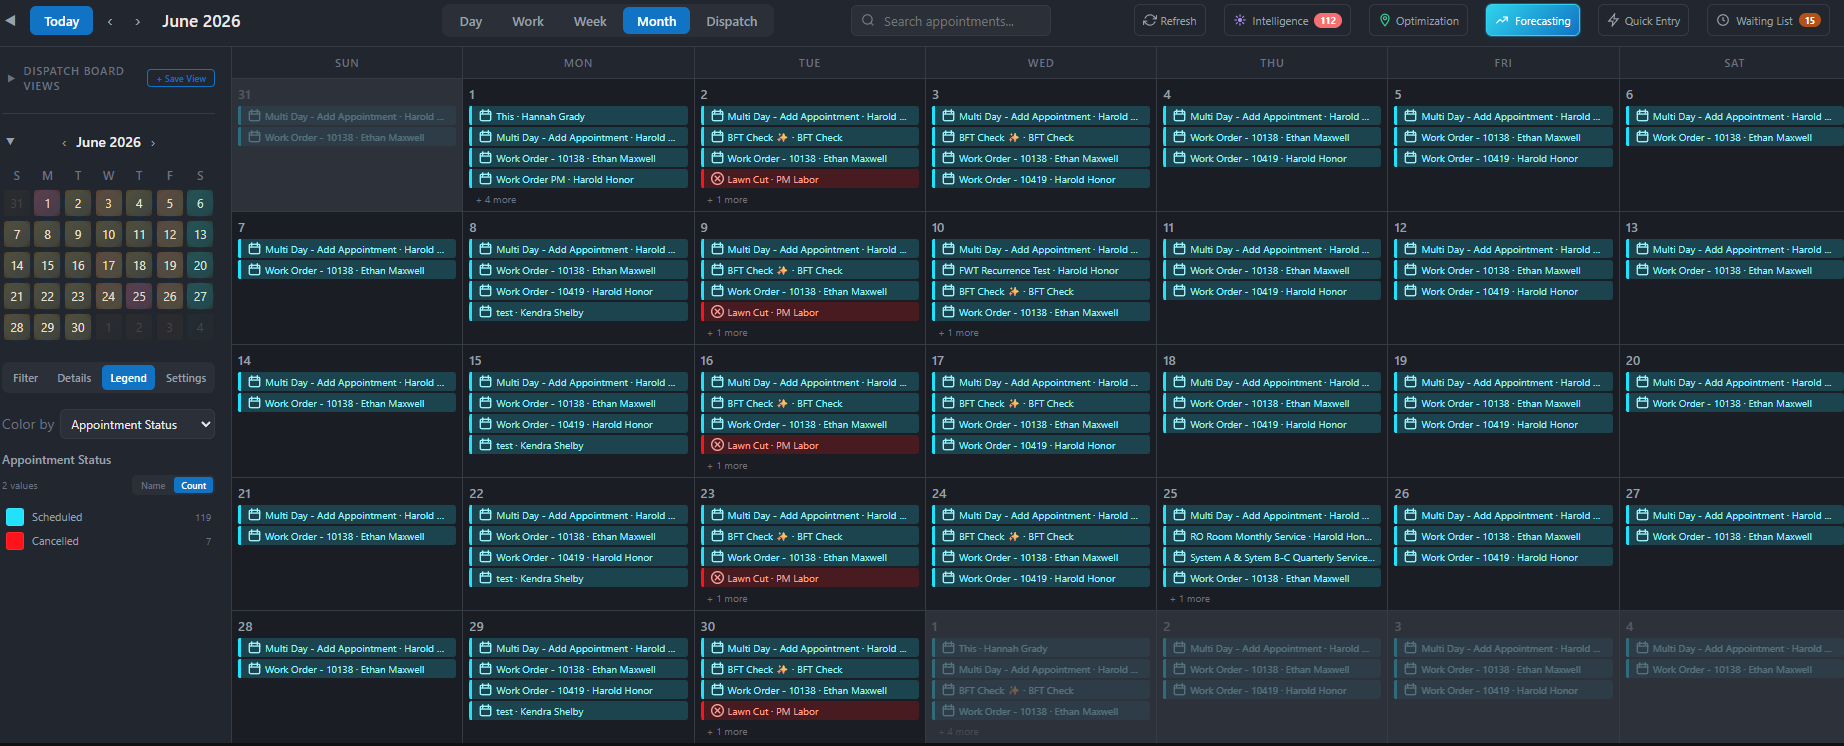
1. Open Mission Control in Smart Service Cloud
2. Select "Forecasting" from the Toolbar
Mission Control immediately analyzes the previous eight weeks of scheduling history and generates demand projections for upcoming days.
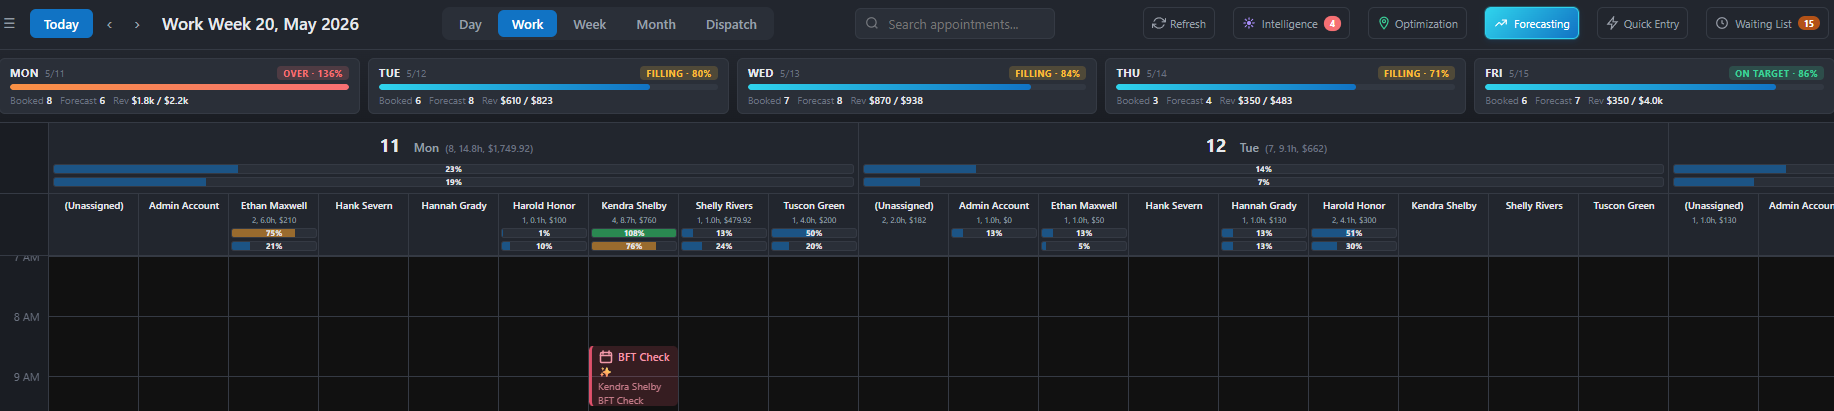
Mission Control Forecasting includes two major visual tools:
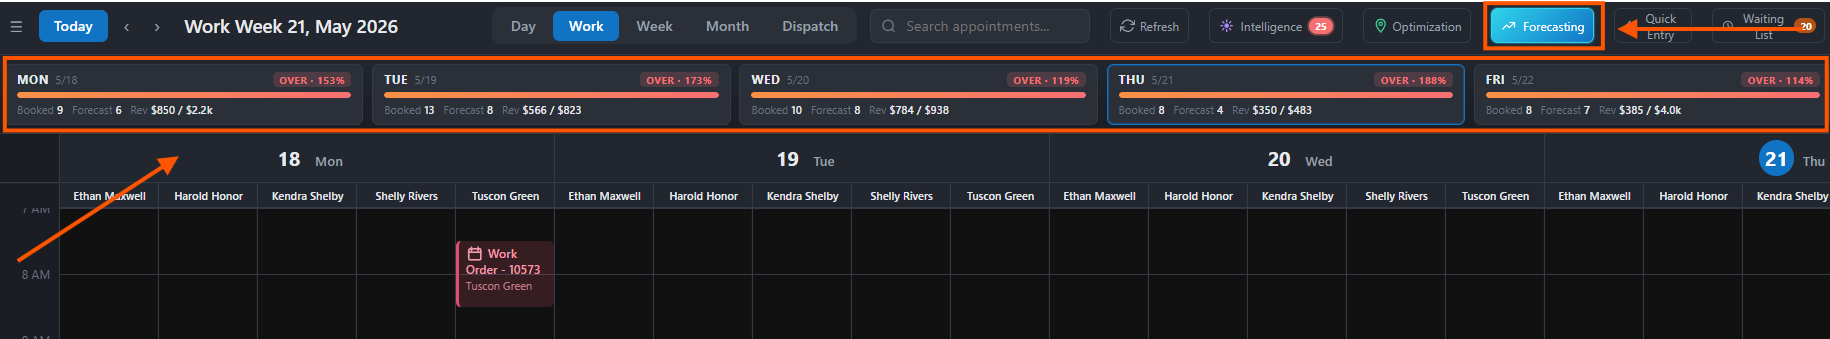
A daily forecasting banner displayed above the calendar.

A color-coded mini-calendar showing booking health across upcoming days.
Together, these provide real-time situational awareness for your schedule.
Each day displays a forecasting card showing:
● Date
● Fill percentage
● Scheduling status bar
● Number of Booked jobs
● Number of Forecasted jobs
● Booked revenue
● Forecasted revenue
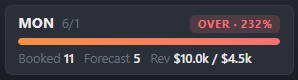
Each forecast card changes color based on booking levels.
The day is performing near expected capacity.
Meaning:
● Approximately 85%–110% of the projected demand is booked


The day is significantly underbooked.
Meaning:
● Less than 50% of the projected capacity is booked
● Strong opportunity to schedule additional work
The interface is organized into several collapsible sections, each featuring a downward arrow to hide or show information:
● Between 50% and 85% of forecast capacity booked

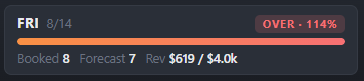
The day is exceeding the normal projected workload.
Meaning:
● More than 110% of the projected demand is booked
● Potential risk for overtime, delays, or scheduling strain
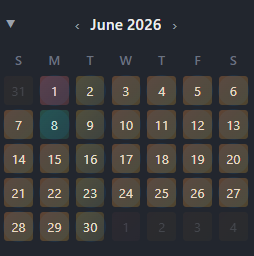
The sidebar mini-calendar displays a heatmap of future scheduling capacity.
Each day is color-coded based on forecast status:
● Orange = Open capacity
● Yellow = Filling
● Green = On target
● Red = Overbooked
This allows teams to identify scheduling opportunities across an entire month at a glance.
A color-coded mini-calendar showing booking health across upcoming days.
Together, these provide real-time situational awareness for your schedule.
Mission Control Forecasting is based on your business’s actual scheduling history.
The system:
● Reviews the previous 8 weeks of completed work
● Groups performance by day of the week
● Calculates average job volume and revenue
● Compares upcoming bookings against those historical averages
This allows the system to recognize patterns such as:
● Busy Mondays
● Slower Fridays
● Seasonal weekly rhythms
● Normal scheduling cadence
Forecasting updates automatically as schedules change.
To get the best results:
● Review Forecasting daily
● Use the heatmap when scheduling future appointments
● Monitor orange days for sales opportunities
● Watch red days for overbooking risks
● Use Forecasting alongside Intelligence and Optimization for full operational visibility
● Forecasting uses the previous 8 weeks of appointment history
● Forecasts update automatically as schedules change
● Waiting-list jobs are not included until scheduled
● Cancelled appointments are excluded from projections
● Forecasting is based on team-wide scheduling patterns
● Future projections are estimates based on historical trends
Most scheduling systems only show today’s calendar.
Mission Control Forecasting shows what tomorrow should look like.
Forecasting removes the guesswork by providing immediate clarity on whether a day is at capacity, underperforming, or overextended.
The result is:
● Better scheduling decisions
● Improved workload balance
● Increased revenue awareness
● Reduced operational surprises
● Stronger long-term planning